Best-Selling Consoles of All Time
Every major game console ranked by lifetime hardware sales, with the software attach rate (games sold per console) where the manufacturer reports it. Figures are official manufacturer numbers, current through Mar 2026.
- 1
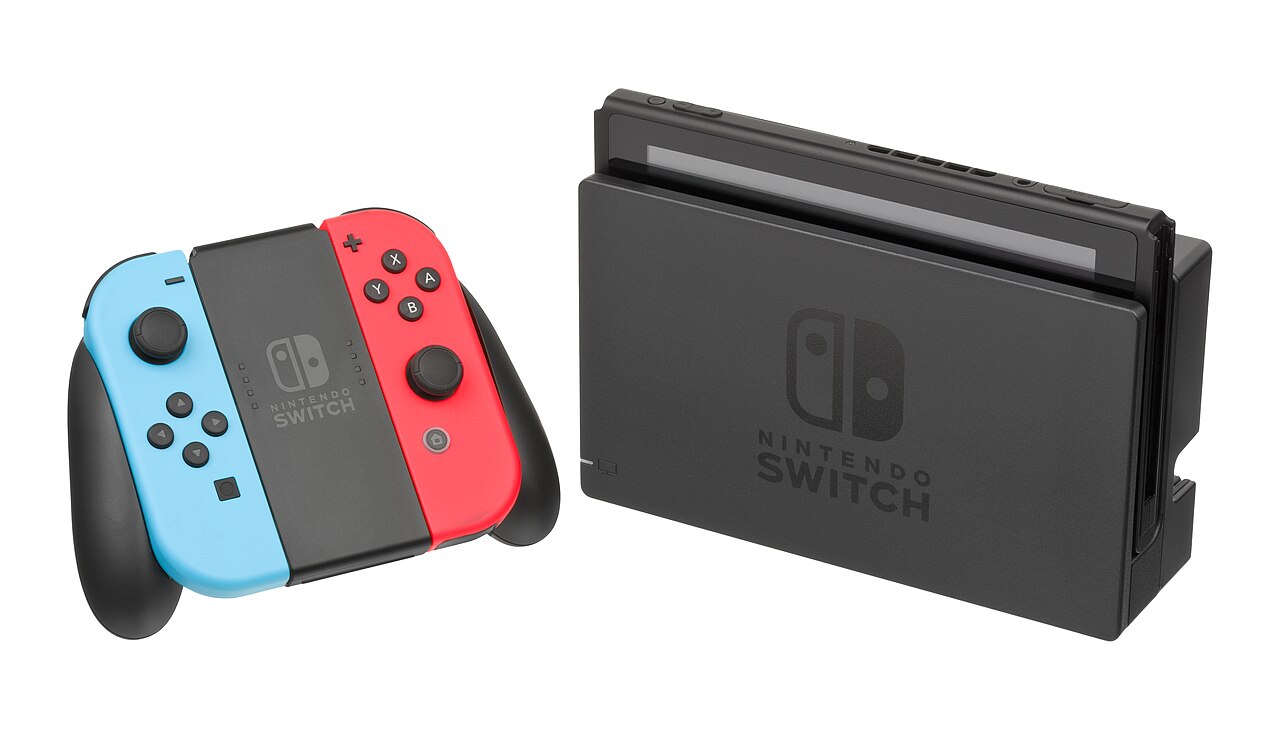 Nintendo SwitchNintendo· 2017· 9.8 games/console155.9Munits
 - 2
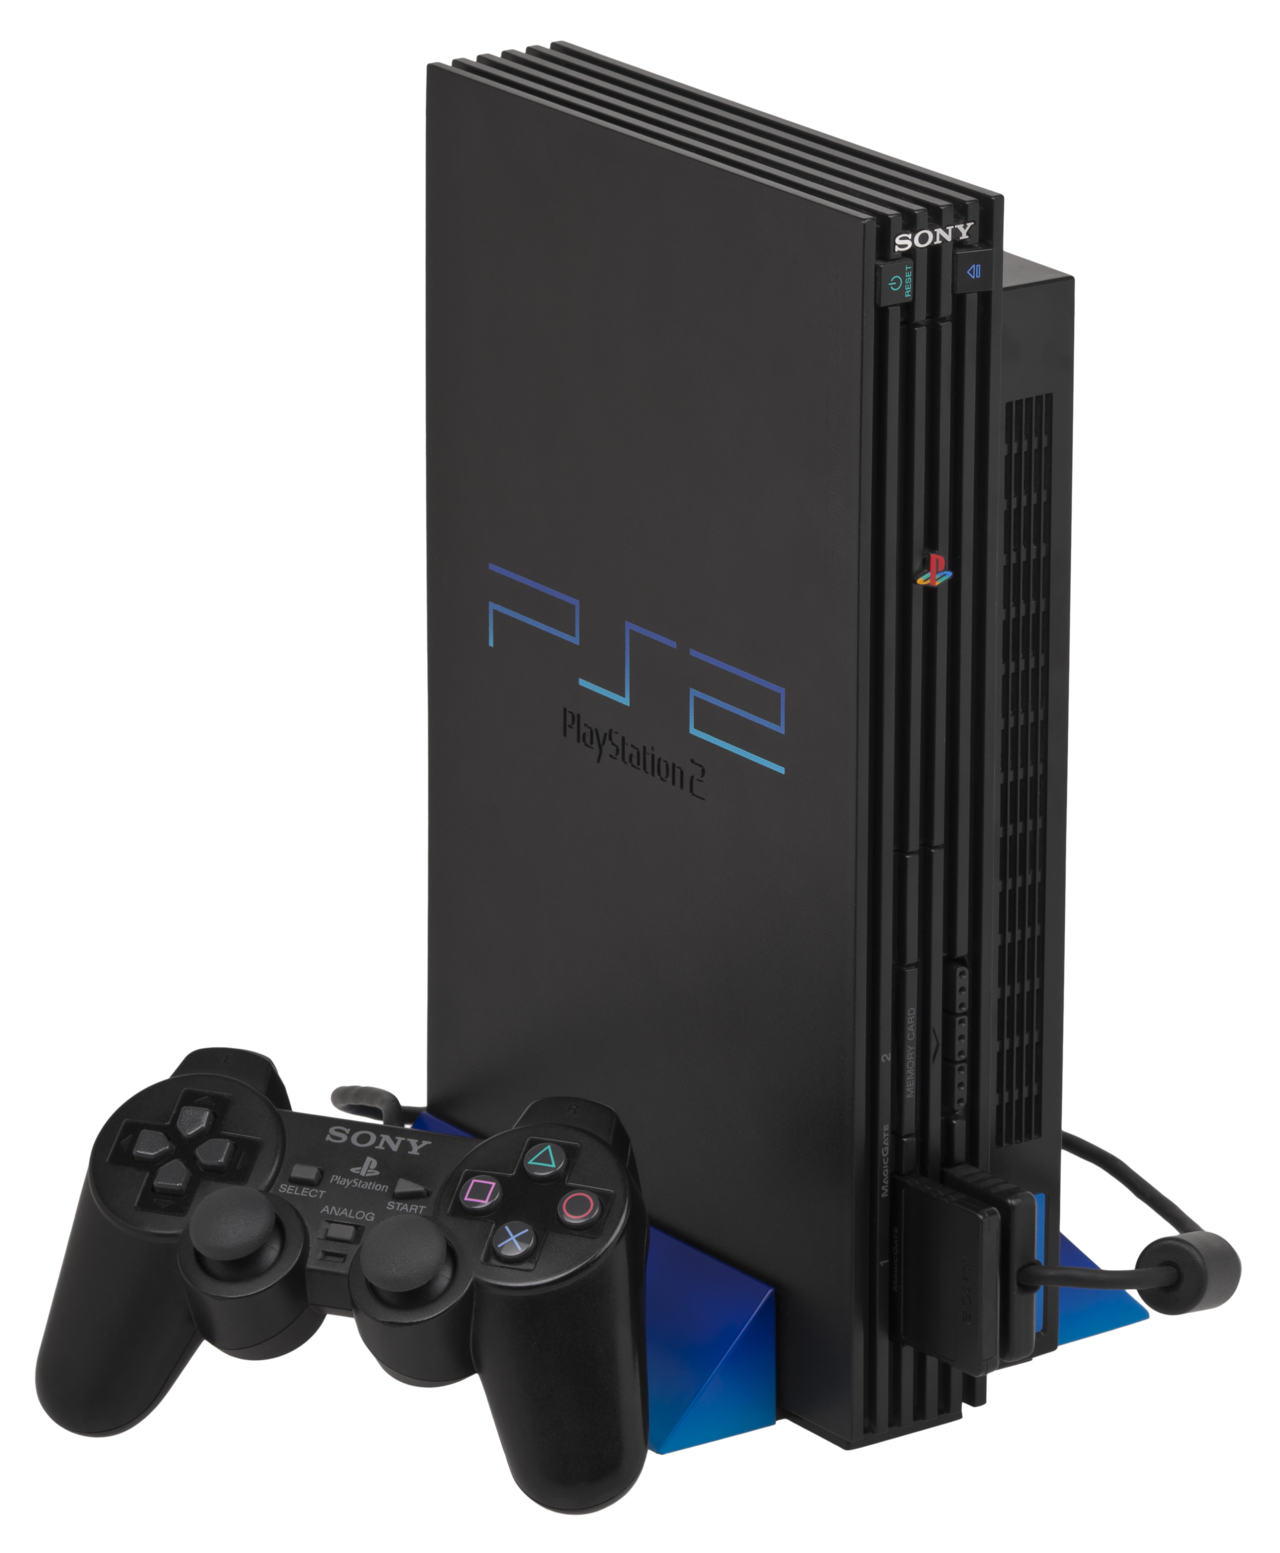 PlayStation 2Sony· 2000155.0Munits
 - 3
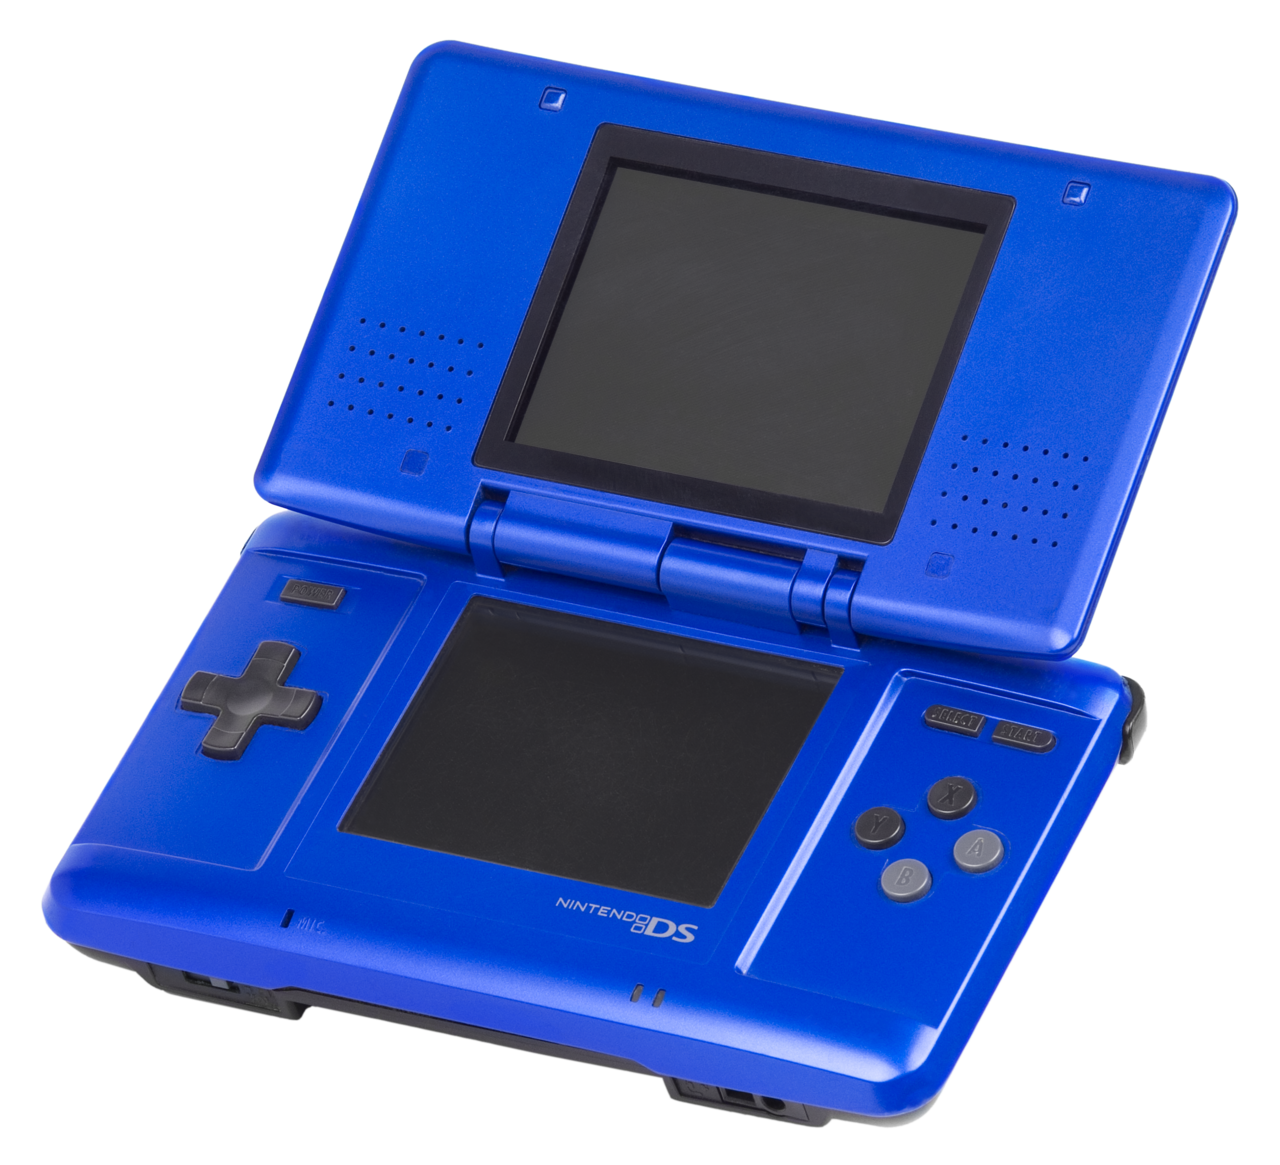 Nintendo DSNintendo· 2004· 6.2 games/console154.0Munits
 - 4
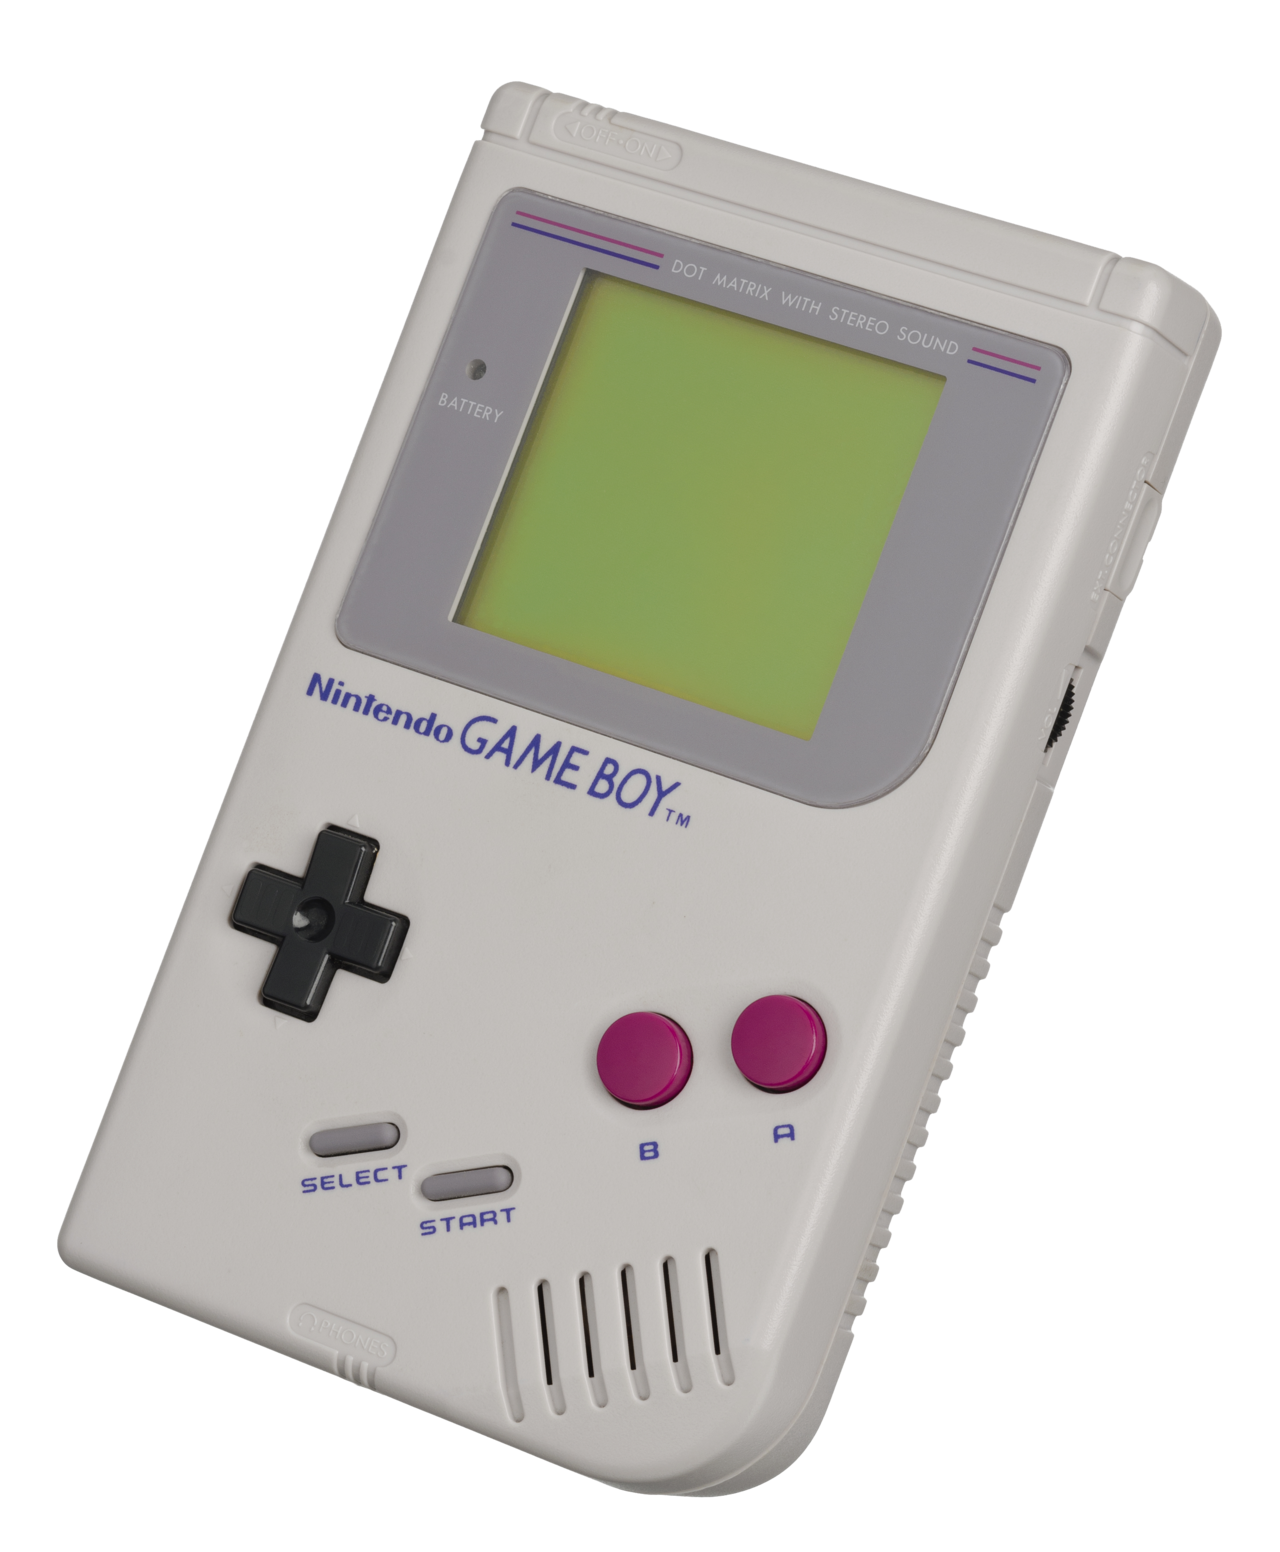 Game BoyNintendo· 1989· 4.2 games/console118.7Munits
 - 5
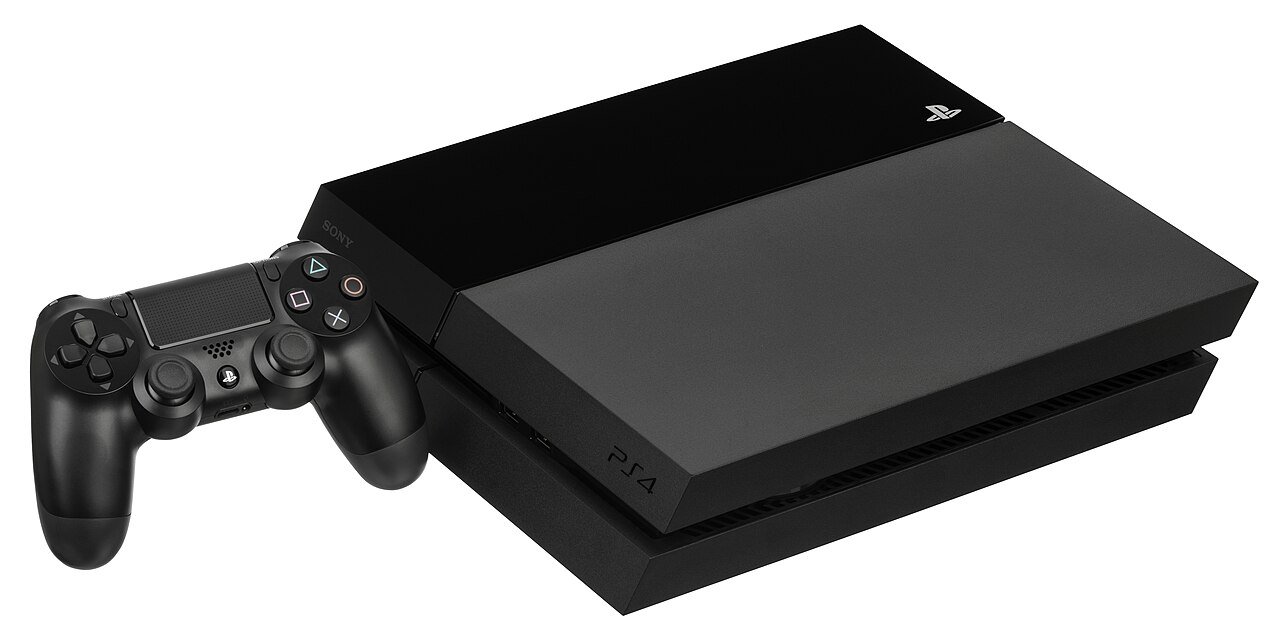 PlayStation 4Sony· 2013117.2Munits
 - 6
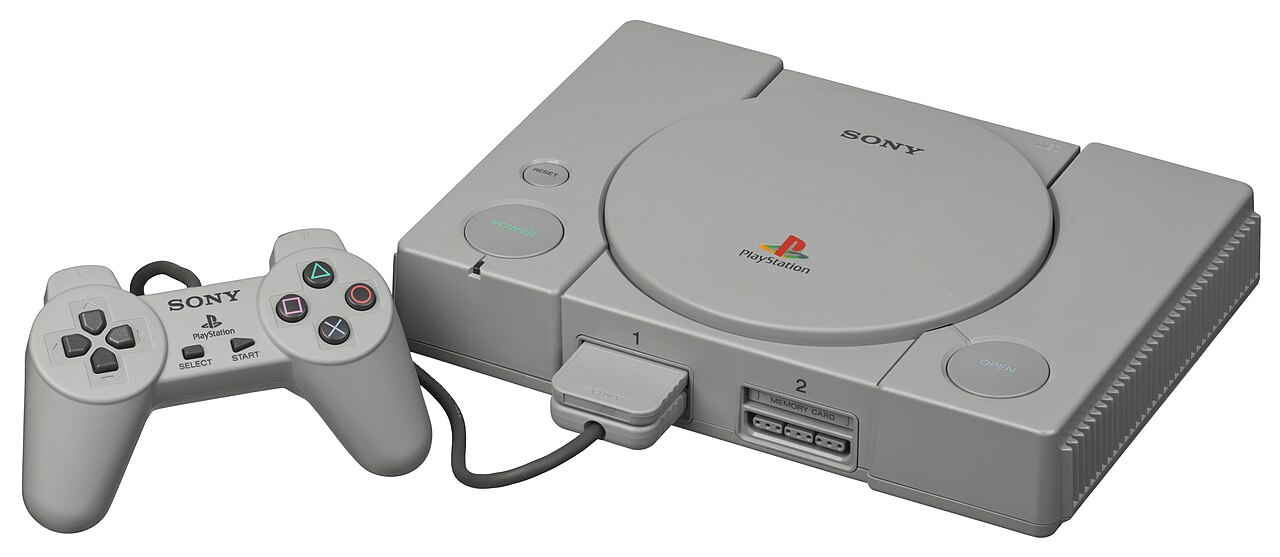 PlayStationSony· 1994102.5Munits
 - 7
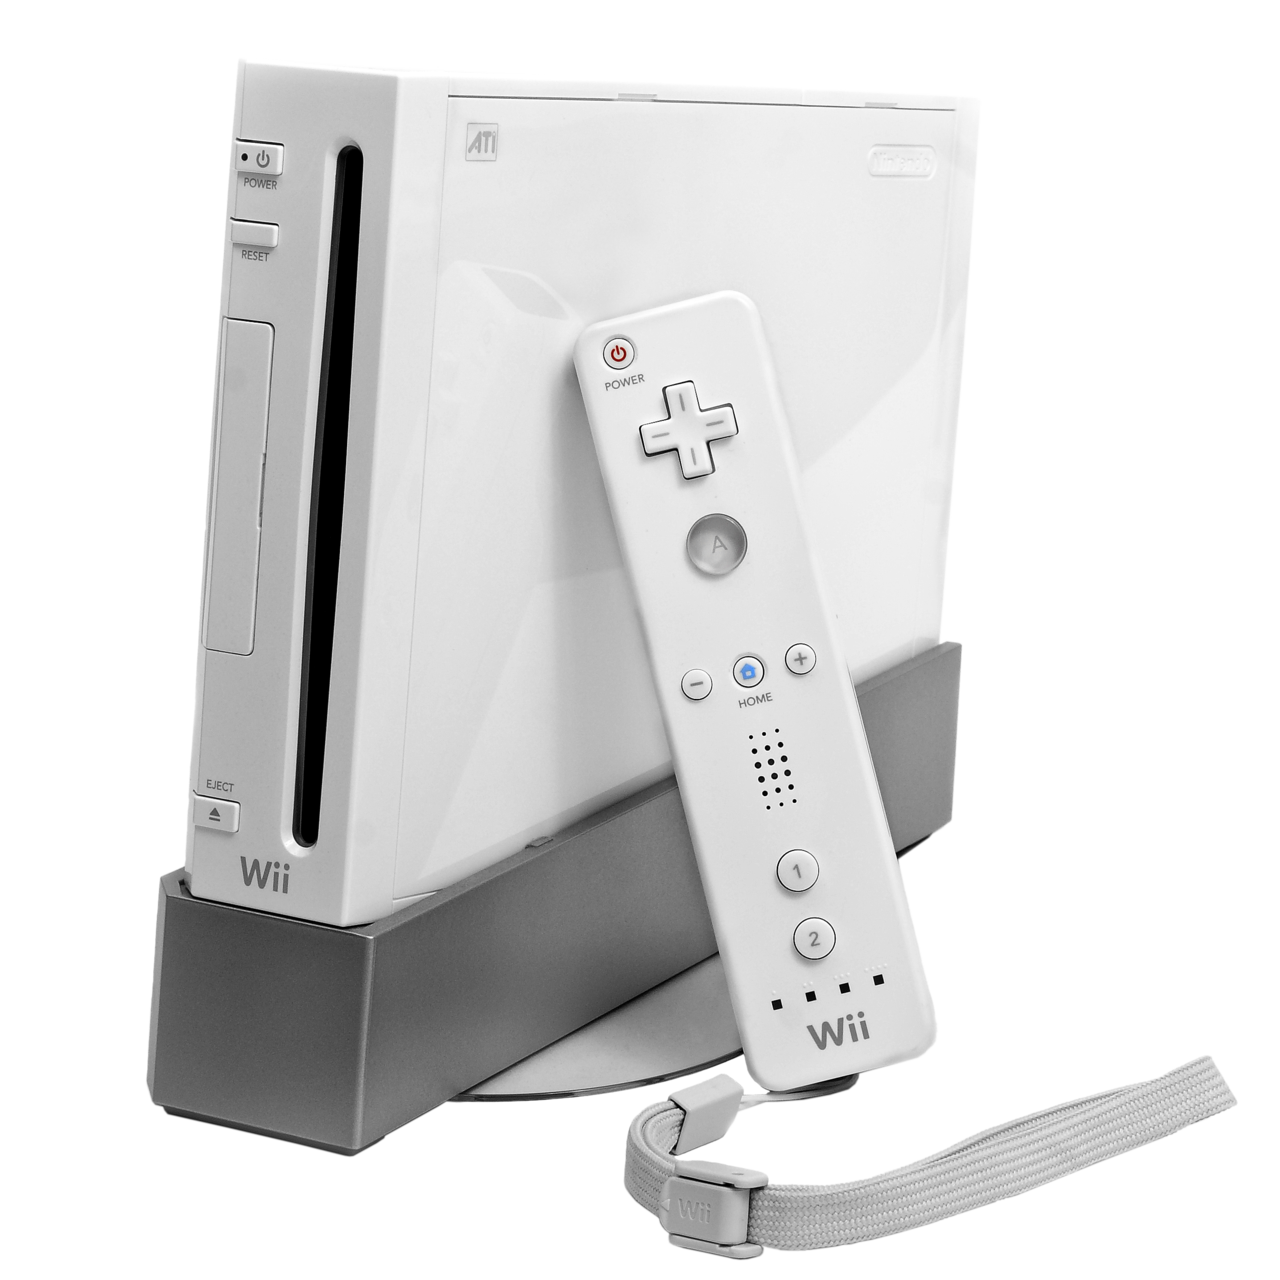 Nintendo WiiNintendo· 2006· 9.1 games/console101.6Munits
 - 8
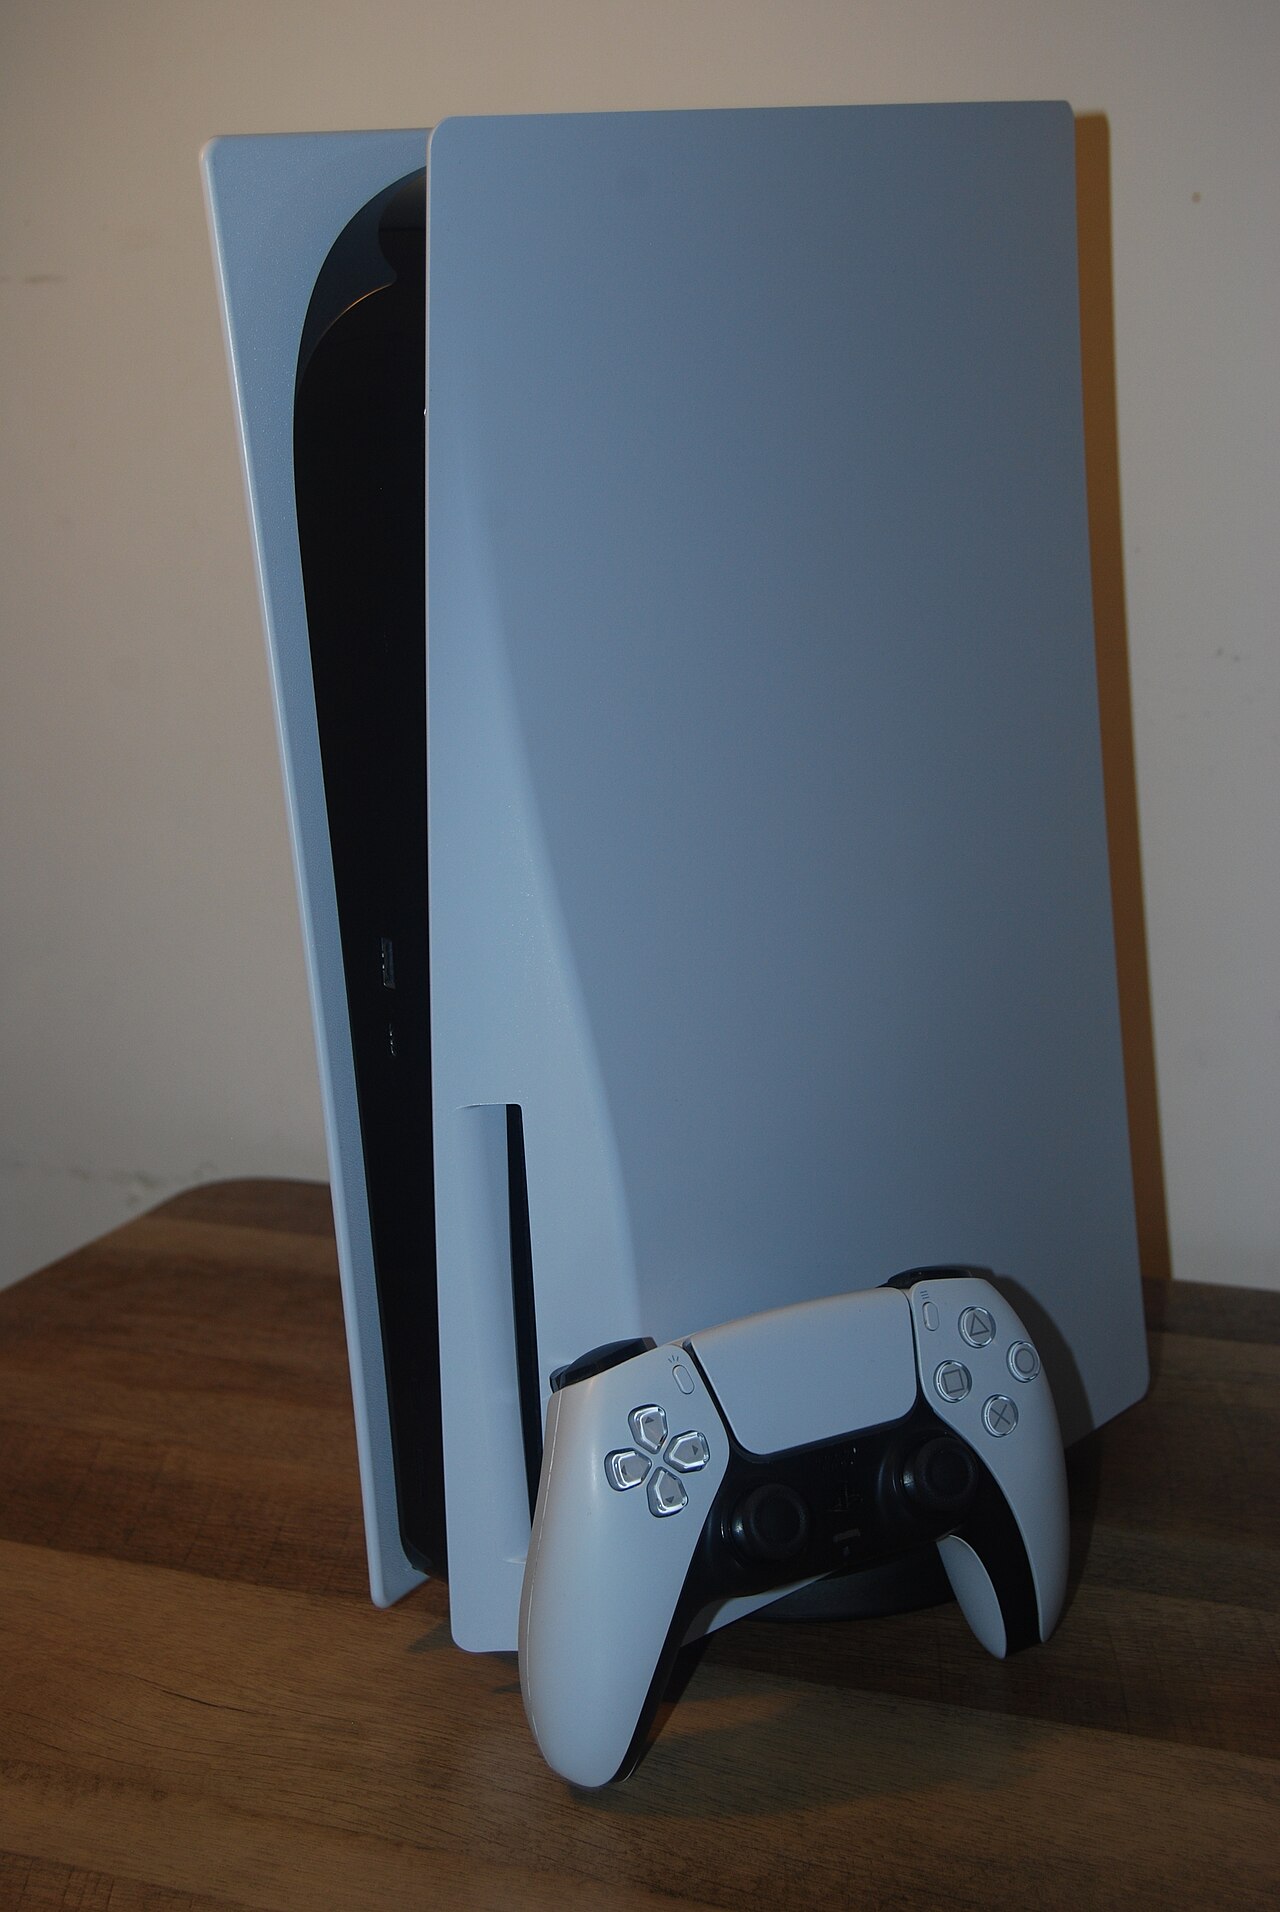 PlayStation 5Sony· 202093.7Munits
 - 9
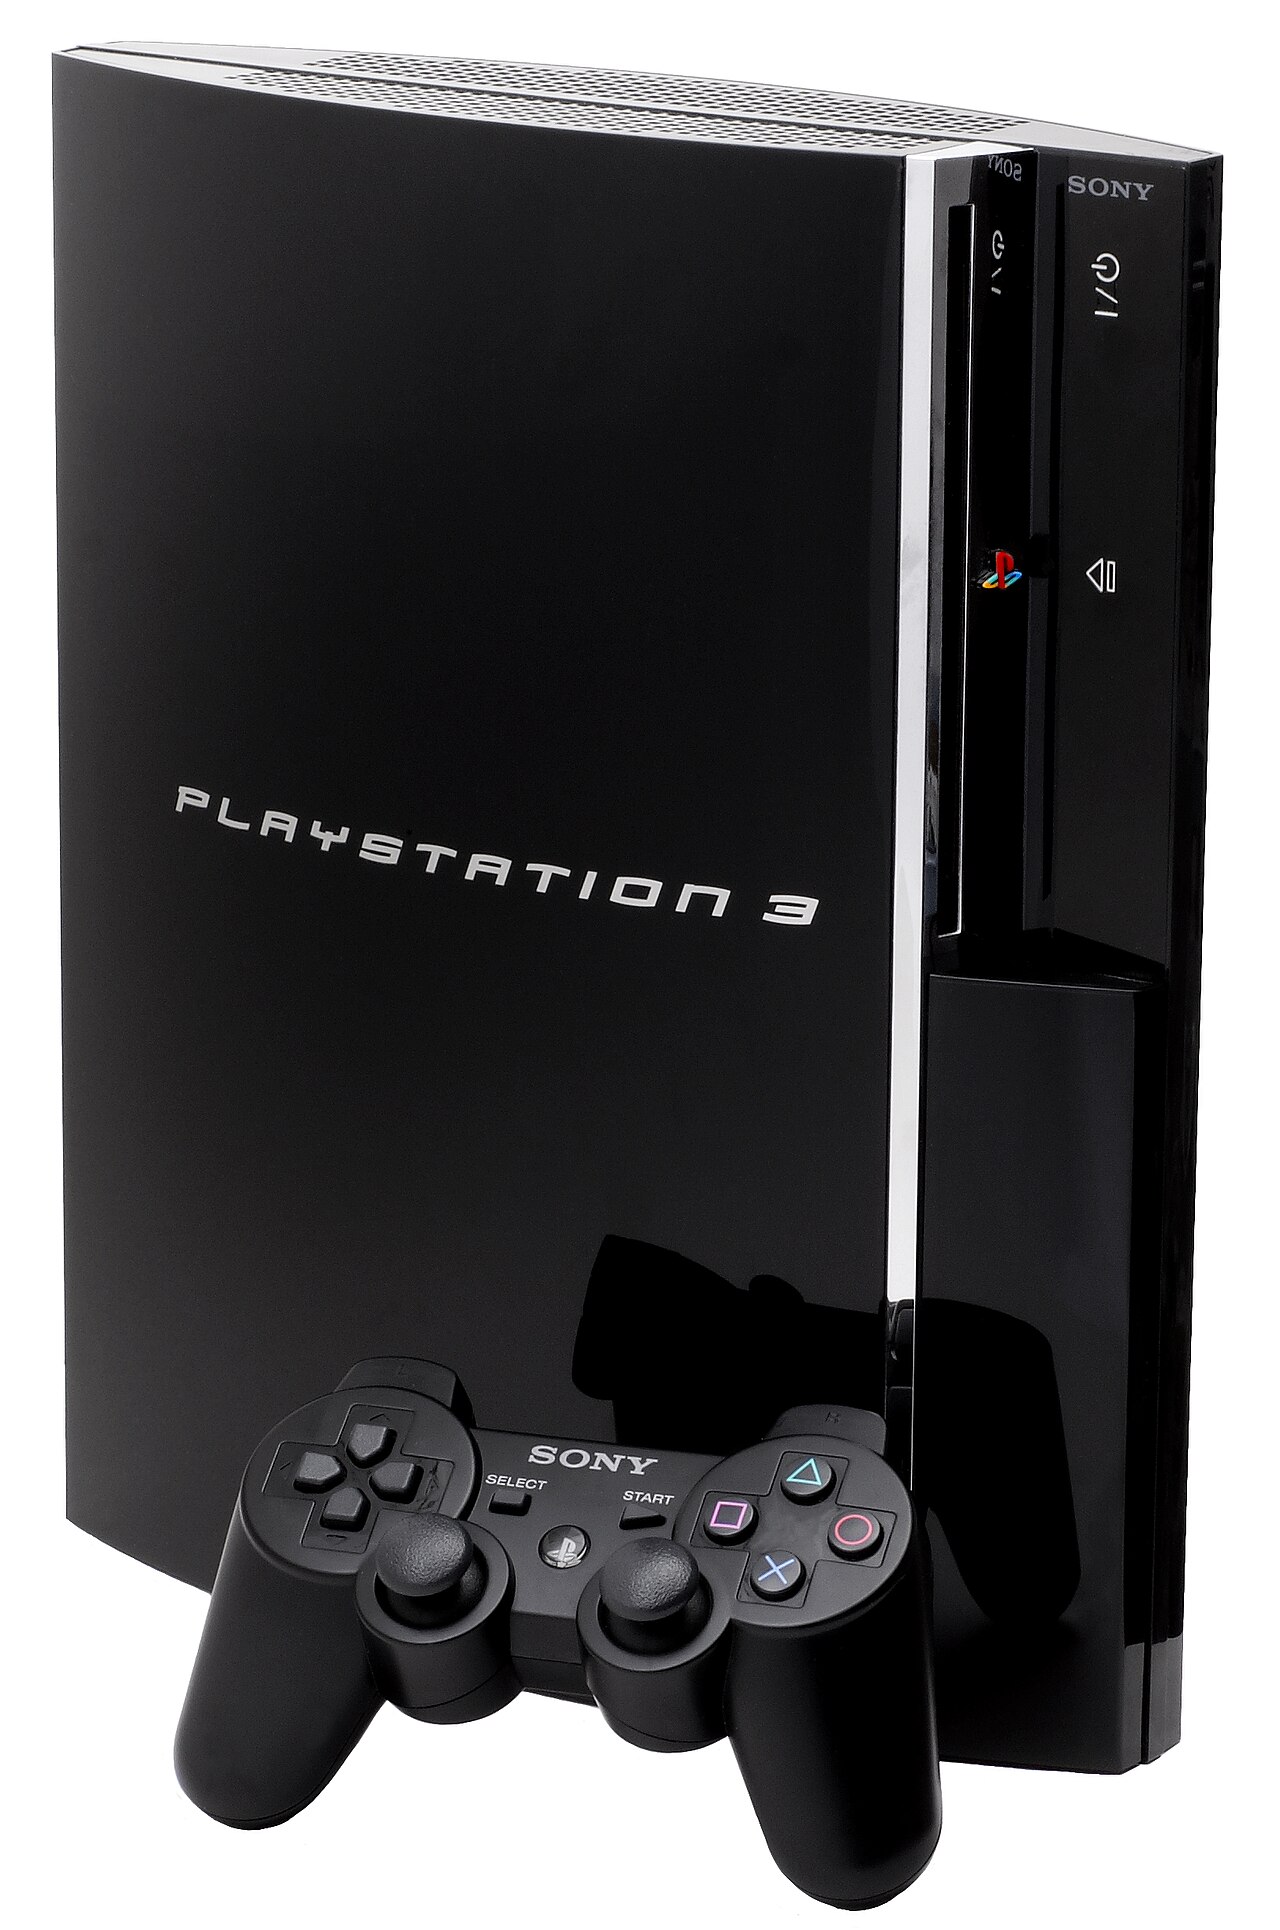 PlayStation 3Sony· 200687.4Munits
 - 10
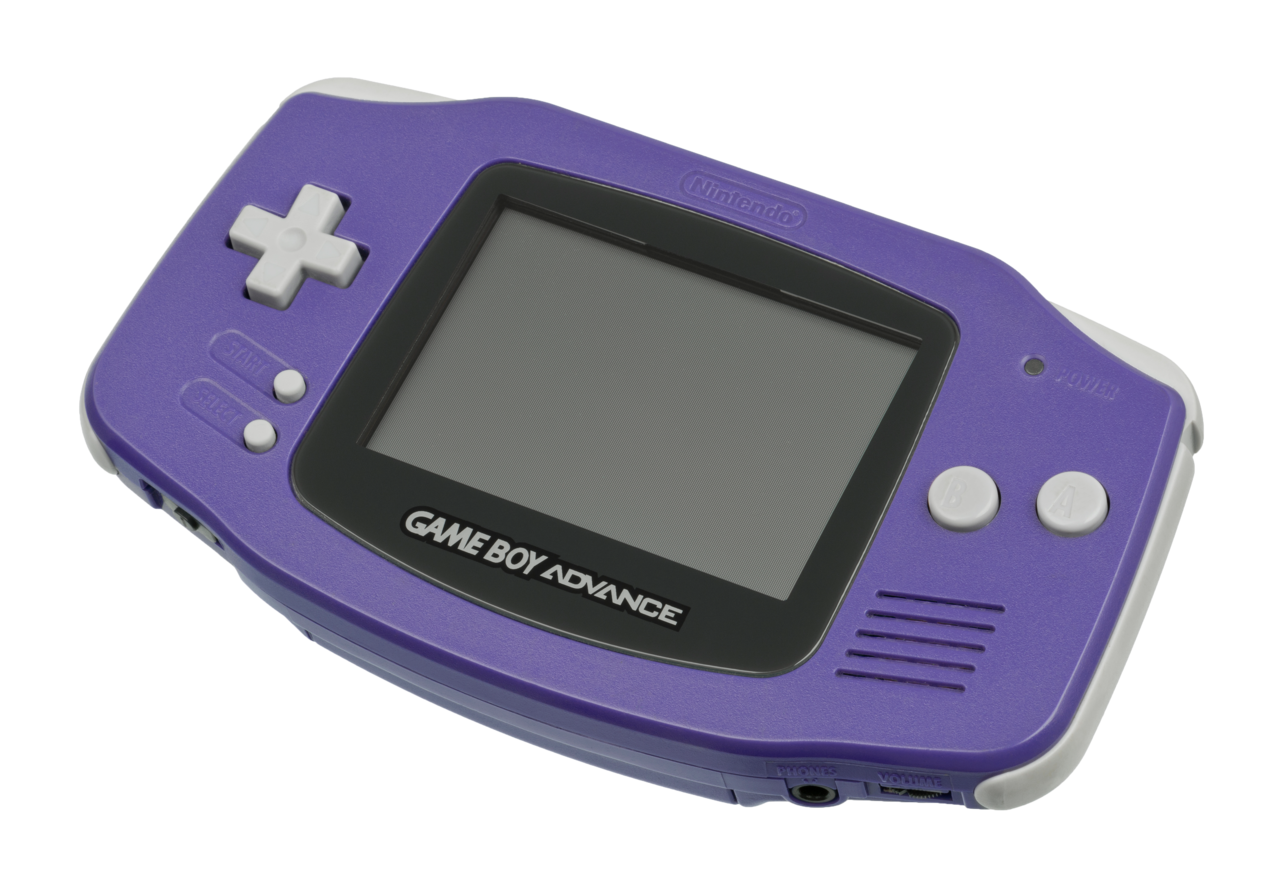 Game Boy AdvanceNintendo· 2001· 4.6 games/console81.5Munits
 - 11
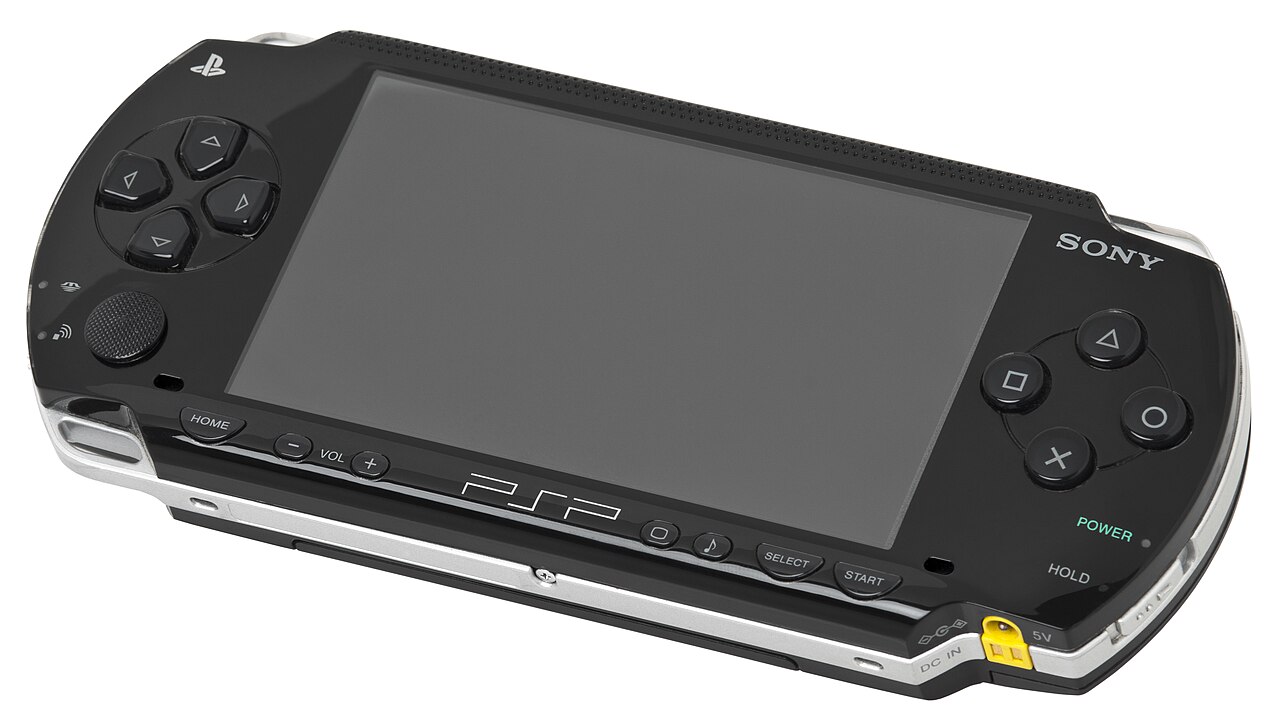 PlayStation PortableSony· 200476.4Munits
 - 12
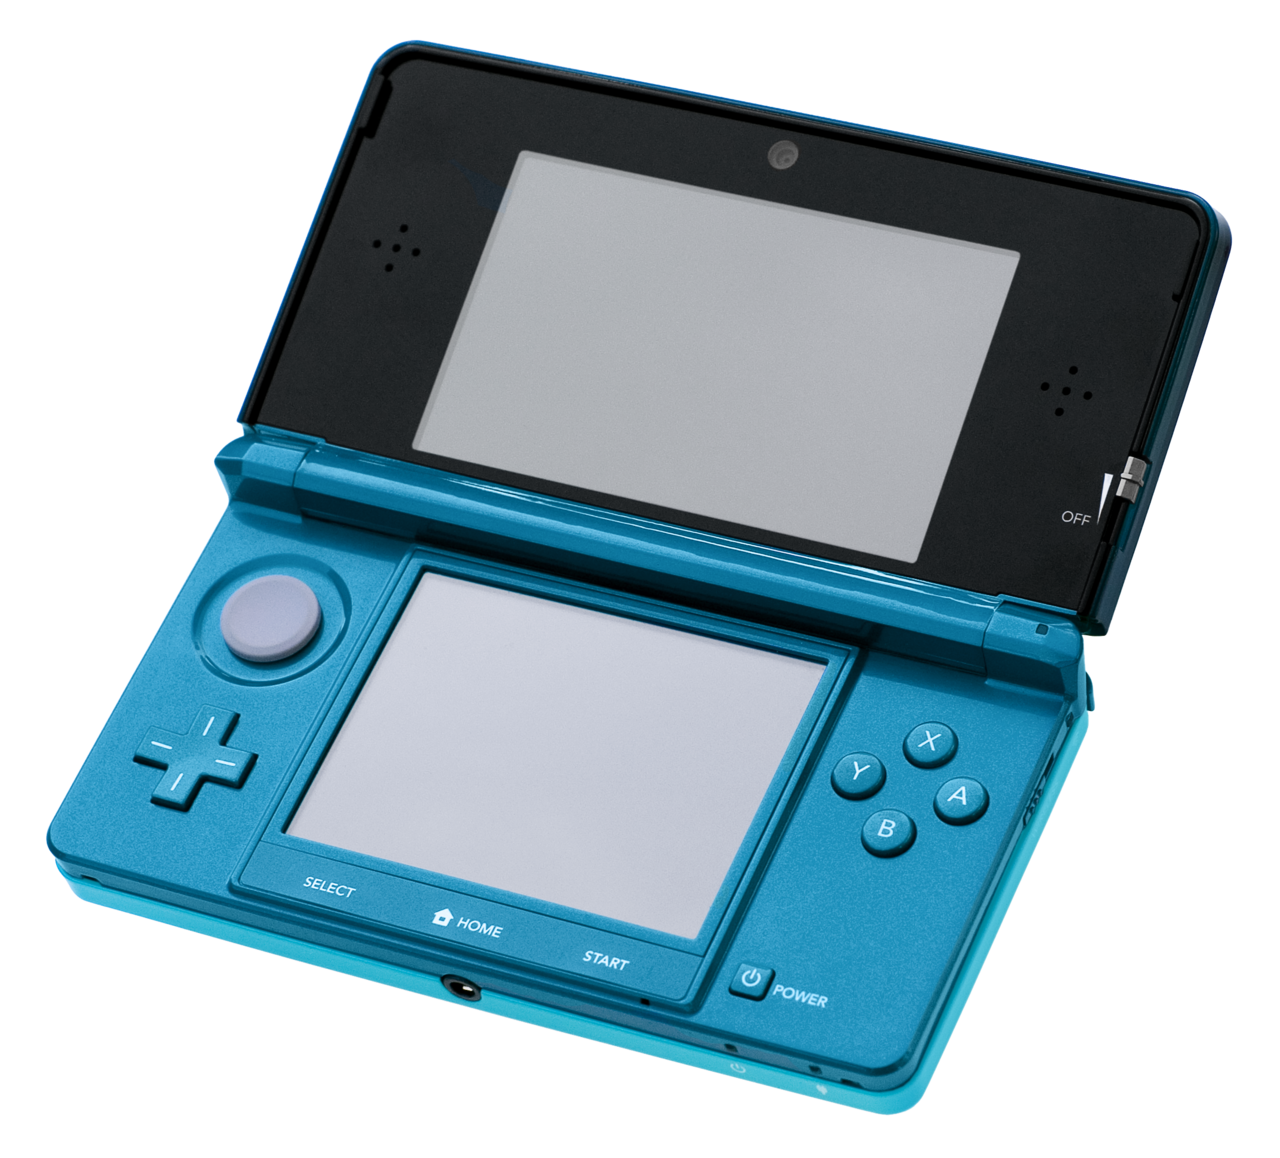 Nintendo 3DSNintendo· 2011· 5.2 games/console75.9Munits
 - 13
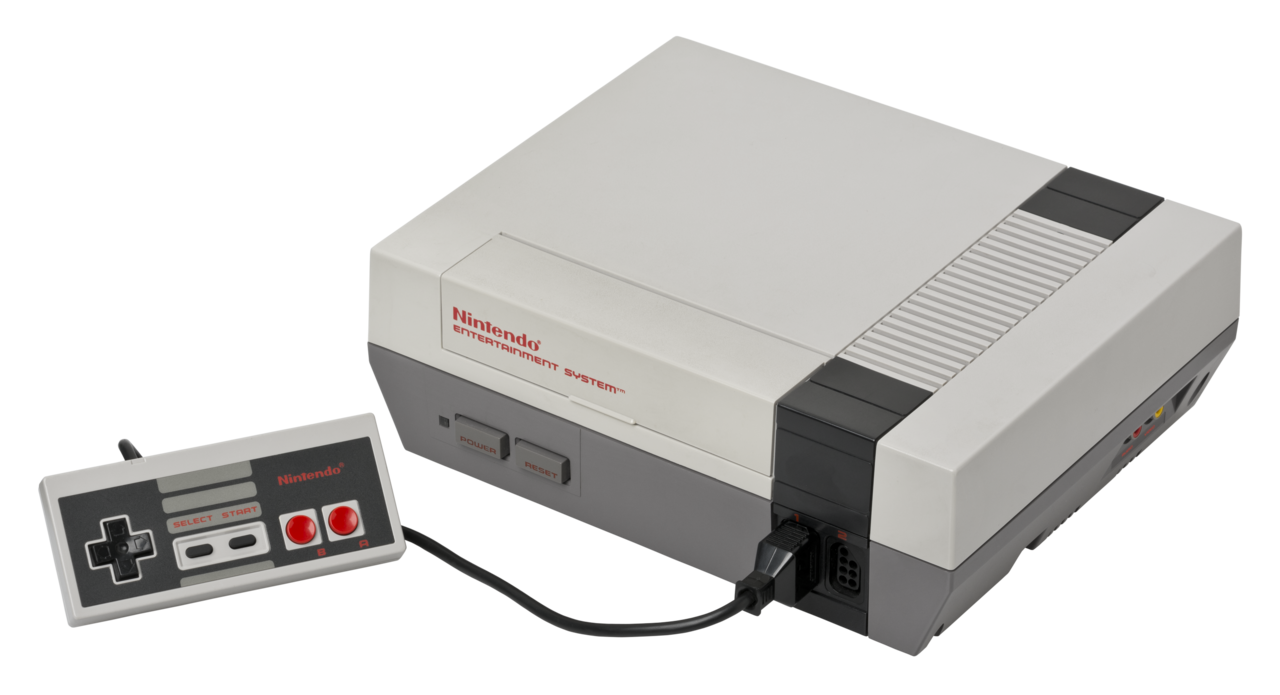 Nintendo Entertainment SystemNintendo· 1985· 8.1 games/console61.9Munits
 - 14
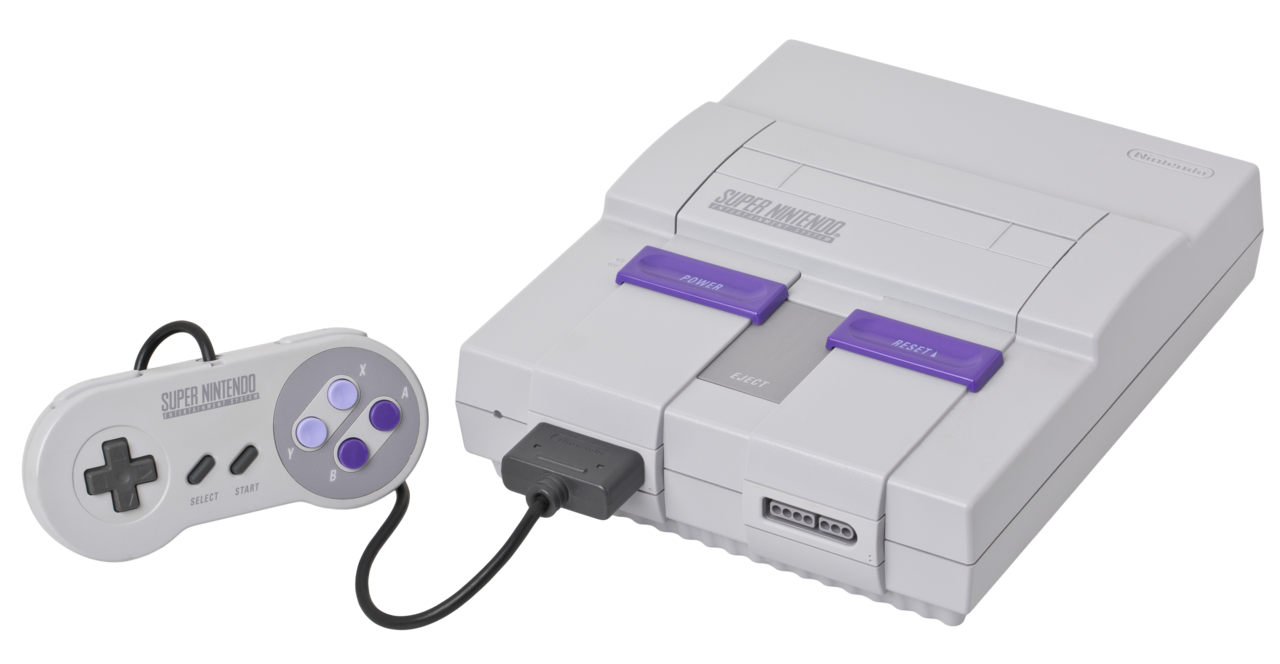 Super Nintendo Entertainment SystemNintendo· 1991· 7.7 games/console49.1Munits
 - 15
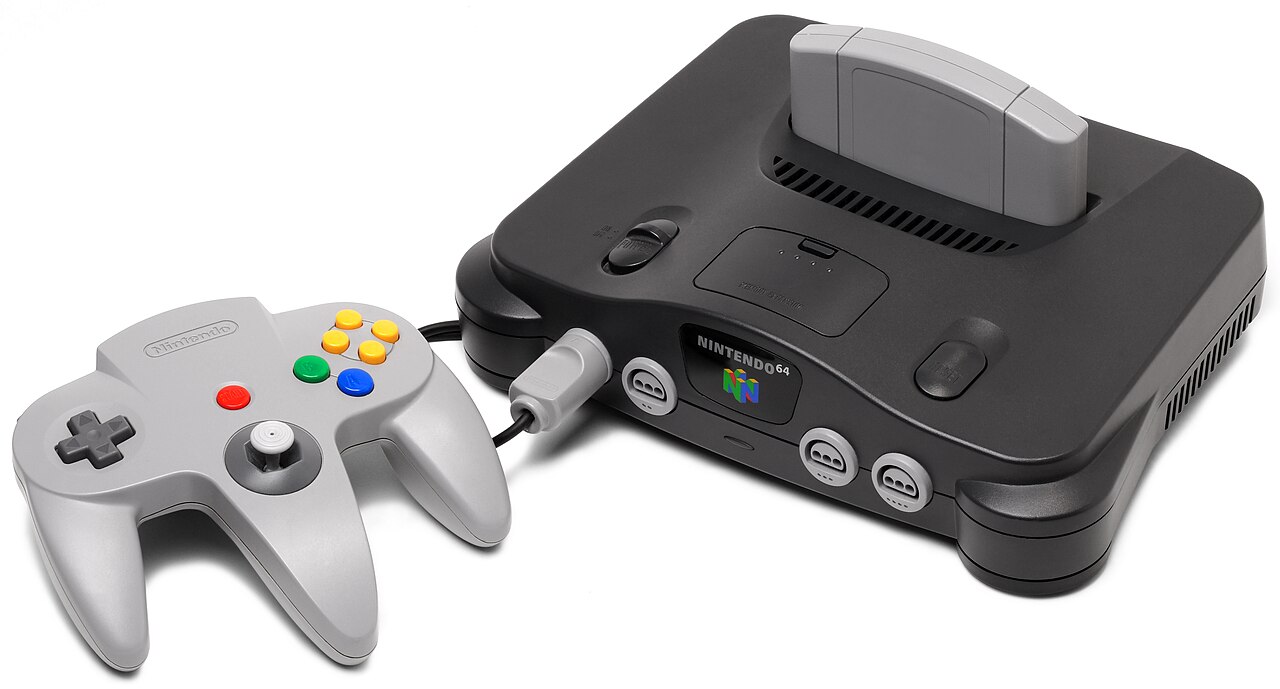 Nintendo 64Nintendo· 1996· 6.8 games/console32.9Munits
 - 16
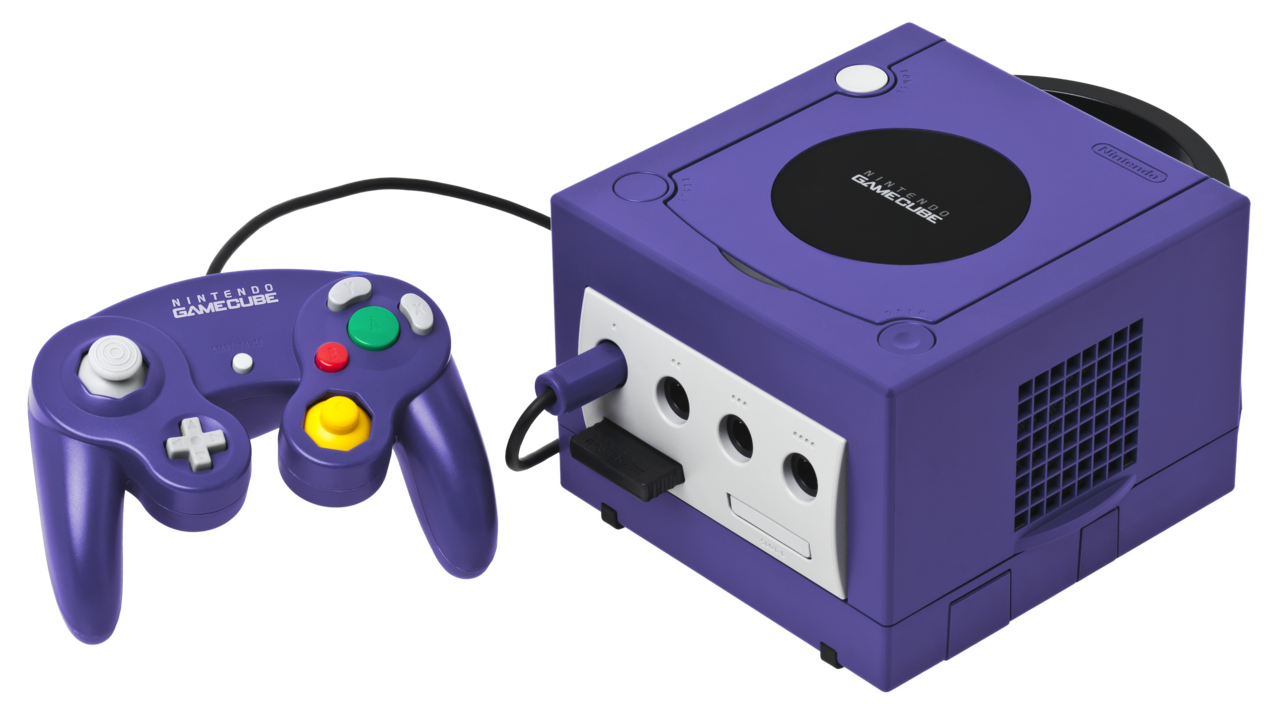 Nintendo GameCubeNintendo· 2001· 9.6 games/console21.7Munits
 - 17
 Nintendo Switch 2Nintendo· 2025· 2.5 games/console19.9Munits
 - 18
 PlayStation Vitaest.Sony· 201115.8Munits
 - 19
 Nintendo Wii UNintendo· 2012· 7.6 games/console13.6Munits
Lifetime hardware figures are manufacturer-reported: Nintendo (Dedicated Video Game Sales Units) and Sony Interactive Entertainment. Each console's page cites its exact source. Totals are cumulative through each platform's latest report, so older discontinued consoles reflect their final official tally.
Why no Xbox?Microsoft stopped disclosing Xbox console unit sales in 2022, so no official figure exists to rank — we don't guess. Figures markedest.are industry estimates (the manufacturer never reported them).